Clustering Project - Customer Segmentation
🚨The dataset of this project is from UK based non-store online retail.
1. Introduction
Every business must effectively allocate limited resources across various tasks, given the inherent constraints. In today’s data-driven era, characterized by the constant generation of vast amounts of information, the ability to uncover concealed patterns and derive meaningful insights from complex datasets is of utmost importance. The challenge arises when grappling with large volumes of data, making it arduous to discern the pertinent details.
This project aims to unveil latent data patterns and segment customers into distinct groups to gain a deeper understanding of their behaviors. The dataset is from non-store online retail data consisting of 541,909 observations and eight features. Leveraging transaction data, specifically the invoice date and customer purchase amounts, a feature engineering process was undertaken to construct informative metrics. Among these metrics, cohort analysis was employed to categorize customers based on their initial purchases and track subsequent behavior, including the proportion of active customers over time and the recency of their purchases. Additionally, customer frequency (shopping frequency) and monetary value (purchase amounts) were determined. Through the utilization of these recency, frequency, and monetary metrics, customers were segmented into 3-4 distinct groups. These customer segments provide a robust foundation for interpreting customer behavior and formulating targeted marketing strategies tailored to each group.
2. Goal
- Segmenting customers into distinct groups with unique characteristics allows for a deeper understanding of their needs and enables businesses to prepare strategies tailored to them.
3. Methodology
- Data preprocessing was performed, which involved tasks such as normalization and feature engineering. During feature engineering, metrics such as Cohort, Recency, Frequency, and Monetary were constructed to gain meaningful insights from the data.
- The following unsupervised learning models were employed: Cohort Analysis, RFM analysis, Kmeans, and Hierarchy model.
4. Insights
- Based on the analysis results, customers can be segmented into 3 or 4 groups, depending on the specific needs of the business.
- When dividing customers into three groups, the most loyal customers exhibit a high level of spending, with an average of $168,745. In contrast, the least loyal group has a considerably lower average spending of $409. Also, royal customers tend to make more frequent purchases, while the least loyal group shows a longer gap between purchases.
5. Figure
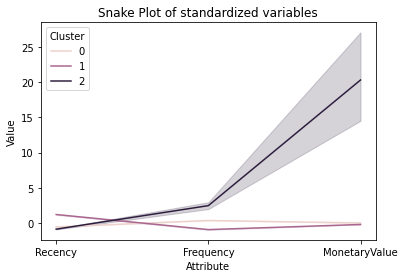
[Fig. Clustering features]
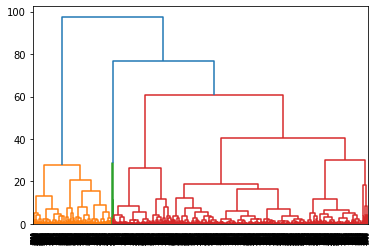
[Fig. Hierarchical Clustering ]
6. Code
For more detailed analysis and code, please check my Colab notebookHERE